Everything you wanted to know about Asian Americans this year. AAs…

1. …are still the fastest-growing racial group in the U.S.
Between 2009 and 2014, the Asian American population grew by 25 percent, from 16.4 million to 20.5 million, according to the U.S. Census Bureau. The AA population is projected to grow by another 5.2 million by 2019, and to outnumber Hispanics by 2055.

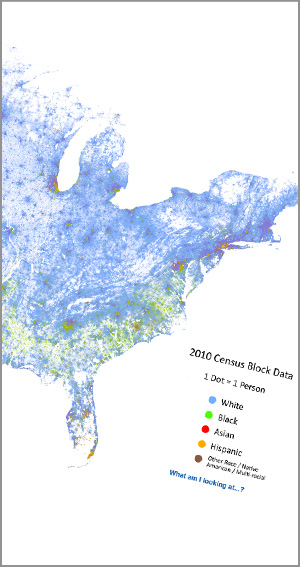
2. …are increasingly expanding to the South and the Midwest.
According to a Nielsen consumer report, the Asian American population saw a 33 percent growth between 2009 to 2014 in the South, and 29 percent in the Midwest.
The West, however, remains the main hub for the segment, home to 9.5 million of the AA population as of 2014.

3. …have the third-largest purchasing power of all multicultural groups.
Asian Americans have $825 billion in buying power. That means that, as a country, they would rank No. 18 economically and have a higher GDP than Turkey, according to a Nielsen consumer report released in May.
By 2020, that power is expected to increase to $1.1 trillion, the report said.

4. …make the most of all racial groups on average.
The national household median income was $53,657 as of the 2014 U.S. Census. On average, Asian American households made $74,829, making them the wealthiest segment in the nation.
Broken down by region, Asians in the Northeast made the most on average, followed by those in the West, the South and the Midwest, according to Nielsen. By ethnicity, Indians had the highest average household income, with $101,591. Filipinos ($82,839), Japanese ($70,261) and Chinese ($69,586) followed.

5. …are also experiencing a growth in poverty.
In 2012, 12.8 percent of Asians and 20.4 percent of Pacific Islanders lived in poverty, according to American Community Survey. As the AA population rises, so does the number living in poverty — from 2007 to 2011, the number of AAs living in poverty rose by 37 percent, compared to the national 27 percent, according to the Center for American Progress. Pacific Islander Americans fared even worse, with a 60 percent increase in that same time frame.
By ethnicity, Southeast Asians were among the poorest groups in the nation, with a 29.3 percent poverty rate among Cambodians and 37.8 percent among Hmong, by the White House Initiative on Asian Americans and Pacific Islanders’ estimate.

6. …are the most-educated group in the country.
In 2015, 54 percent of Asians in the nation had a bachelor’s degree or higher, compared to 33 percent for the entire U.S. population, according to a Census Bureau report on adults 25 years and older.
The same report found that bachelor’s degree attainment had risen 25 percent from 1995 to 2015 among all 25- to 29-year-olds nationwide.

7. …are voting more than ever.
The Asian American vote nearly doubled from 2000 to 2012, from 2 million to 3.9 million, according to the Center for American Progress.

8. …are more Democrats than Republicans.
In 2016, 47 percent of Asian American registered voters as identified as Democrats, according to data from APIAVote and the Asian American Voter Survey. Fifteen percent identified as Republican, and 37 percent did not identify with either party.

9. …do not like Donald Trump.
A poll conducted by a group of Asian American advocacy groups this spring asking 1,212 registered AA voters showed that they had a notably low favorability rating of Donald Trump — 19 percent, compared to 41 percent by the general public. Hillary Clinton enjoyed a 62 percent favorability rating by the same group.
While 45 percent of the general public views the Democratic Party favorably, 66 percent of AAs felt the same way, with only 19 percent of them viewing the Democratic Party unfavorably.
In contrast, 28 percent of the same group viewed the Republican Party favorably, with 46 percent viewing the party unfavorably.

10. …use the internet more than any other group.
According to a Pew Research Center survey last year, 95 percent of English-speaking AAs used the internet, compared with 87 percent of whites, 81 percent of blacks and 82 percent of Hispanics.
Asians also led other groups in using broadband at home and in owning a smartphone — 91 percent of AAs were smartphone users, compared with 66 percent of whites, 62 percent of blacks and 65 percent of Hispanics.


